
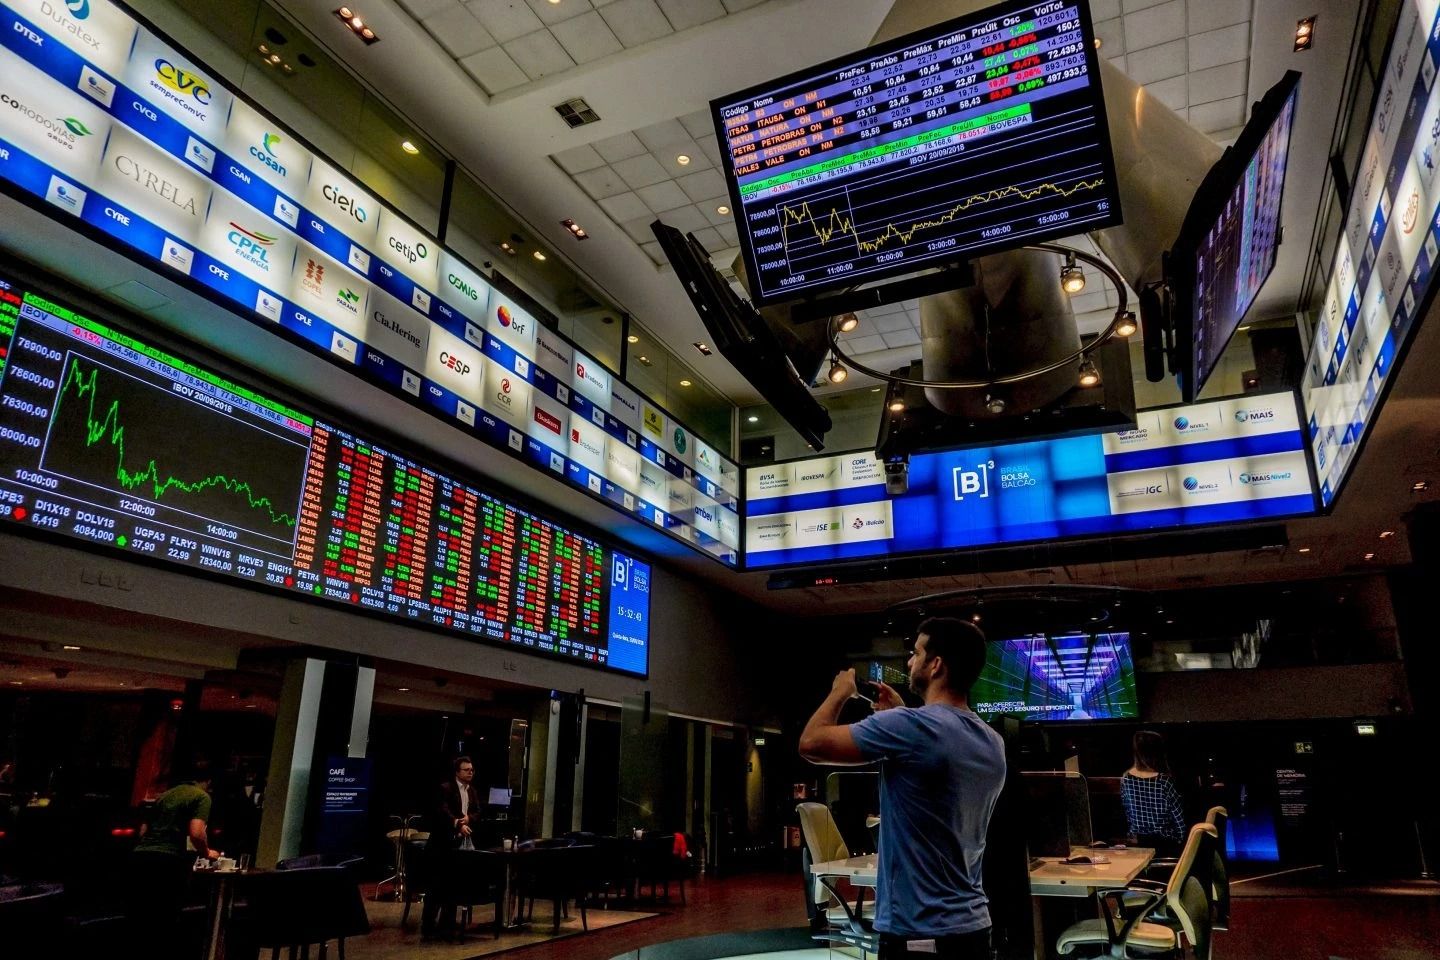
Ibovespa hits record highs in 2026
The B3 stock exchange has delivered a historic start to 2026, with the Ibovespa index surging to unprecedented levels. By mid-April, the benchmark index touched a record high of 199,354.81 points, marking a significant milestone for Brazilian equities. This rally is not merely a domestic phenomenon but a result of intense capital inflows from abroad, positioning Brazil as a key destination for global investors seeking yield and growth.
Foreign capital has been the primary engine behind this ascent. According to market data from late February, international investors had already poured more than R$20 billion into B3's secondary market within the first two months of the year. This aggressive buying pressure has driven the Ibovespa up by approximately 18.5% year-to-date, outpacing many emerging market peers. The influx reflects a broader reassessment of Brazilian assets, driven by attractive valuations and robust commodity prices.
To visualize this momentum, the chart below tracks the Ibovespa's trajectory through April 2026, highlighting the steep climb that led to the new all-time high. The technical breakout above previous resistance levels suggests strong institutional confidence in the near-term outlook for Brazilian equities.
Foreign capital fuels the rally
Foreign investment has become the primary engine behind the B3 index surge in 2026. Capital inflows into B3’s secondary market have already surpassed R$20 billion, establishing a clear upward trajectory for the year. This sustained buying pressure from international investors is the dominant force driving the Ibovespa’s 18.5% gain through February.
The scale of these inflows signals a significant shift in market sentiment. International funds are positioning themselves aggressively, betting on Brazil’s economic fundamentals and the relative value of local assets. This external liquidity provides the necessary momentum to push indices higher, often outpacing domestic trading volumes.
The correlation between foreign entry and index performance is direct. As global capital seeks yield in emerging markets, Brazilian equities have benefited from this rotation. The R$20 billion threshold marks a critical inflection point, demonstrating that the rally is not merely speculative but backed by substantial institutional commitment.
This trend suggests that the B3’s strength in 2026 is heavily dependent on continued international interest. Monitoring these inflows provides a clearer picture of market health than domestic indicators alone, as foreign capital often leads broader market corrections or expansions.
Leading sectors in the 2026 recovery
The Ibovespa’s trajectory in 2026 is not uniform; it is being pulled upward by specific industrial and financial pillars that have outperformed the broader market. While the index as a whole reflects the macroeconomic pulse of Brazil, the gains are heavily concentrated in sectors benefiting from commodity stability, domestic credit expansion, and infrastructure investment cycles. Understanding which segments are driving the recovery is essential for positioning within the B3 index, as the performance gap between leading and lagging sectors has widened compared to previous years.
| Sector | YTD Performance | Primary Driver | Trend |
|---|---|---|---|
| Financials | +12.4% | Interest rate spreads | up |
| Commodities | +8.7% | Global supply constraints | flat |
| Utilities | +6.2% | Infrastructure capex | up |
| Consumer Staples | -2.1% | Margin compression | down |
| Materials | +4.5% | Export demand | up |
Financials have emerged as the most significant contributor to the index's gains. This sector’s strength is directly tied to the stability of Brazil’s interest rate environment, which has allowed banks and insurers to expand net interest margins. Unlike previous periods where inflation volatility eroded margins, the current climate has provided a predictable backdrop for credit growth. The performance of major financial institutions within the Ibovespa is closely mirrored by the
chart, which shows a steady upward trend in trading volume accompanying price appreciation.Commodities and Materials continue to provide a solid floor for the index, though their growth rate has moderated compared to the boom years of the early 2020s. The driver here is no longer just volume, but price resilience in iron ore and oil. While global demand fluctuations create noise, Brazilian exporters have maintained profitability through operational efficiency. Utilities, meanwhile, are benefiting from a renewed focus on grid modernization and renewable energy integration, attracting long-term capital seeking stable yields in a volatile market.
In contrast, consumer-facing sectors have lagged. Margin compression due to rising input costs and cautious consumer spending has weighed on staples and retail. This divergence highlights a market that is increasingly selective, rewarding sectors with clear structural advantages or pricing power over those dependent on discretionary household spending. Investors tracking the B3 index in 2026 are thus looking less at broad market beta and more at these specific sectoral alpha opportunities.
B3 Trading Calendar and Rebalancing Cycles
Trading on the B3 exchange follows a structured schedule that shifts around national holidays and specific settlement dates. For 2026, traders should note that CSD2 trading is suspended on January 15, 2026, due to the January 19 holiday. Index options, which typically open at 10:00 am -03, also observe standard weekend closures, requiring adjustments to liquidity expectations on adjacent days. Understanding these interruptions is essential for managing position risk during low-volume periods.
The Ibovespa index undergoes a formal review every four months, with portfolio rebalancing occurring in January, May, and September. This cycle ensures the index maintains its representation of the Brazilian economy, capturing approximately 70% of total traded stock value. These adjustments are governed by strict criteria designed to reflect free-float market behavior, providing a consistent benchmark for domestic and foreign investors.
While the Ibovespa serves as the primary thermometer for the market, B3 maintains a broader suite of indices that track specific segments of the economy. These indices follow the same governance standards but offer granular views into sector performance. Traders should monitor the official B3 announcements for exact rebalancing dates each quarter, as component changes can temporarily impact volatility and trading volumes.
B3 vs Ibovespa: What’s the Difference?
Investors often confuse the exchange with the index it tracks. B3 S.A. – Brasil, Bolsa, Balcão is the physical and digital marketplace where stocks, futures, and commodities are bought and sold. It is the infrastructure, the "plaza," located in São Paulo.
The Ibovespa (Índice Bovespa) is the benchmark indicator calculated by B3. It measures the performance of the most-traded stocks on the exchange. Think of B3 as the engine and the Ibovespa as the speedometer. When news reports say "the market is up," they are referring to the Ibovespa’s movement, not the exchange itself.
How the Ibovespa Is Calculated
The Ibovespa is a free-float market capitalization-weighted index. This means a company’s influence on the index depends on the value of shares available for public trading, not its total outstanding shares. The index is composed of 80 to 85 liquid stocks that represent approximately 70% to 80% of the total volume traded on B3.
B3 reviews the index composition every four months, in January, May, and September. These revisions ensure the index continues to reflect the most active and representative companies in the Brazilian economy. If a stock’s liquidity drops, it is removed; if a new company becomes highly traded, it is added.
Real-Time Updates and Data
The Ibovespa updates in real time during trading hours. It is the primary reference for Brazilian equity performance, used by both domestic and foreign investors to gauge market sentiment.
For a quick snapshot of the current level, you can check the live price widget below.

No comments yet. Be the first to share your thoughts!