
The 2026 Reality Check
Bitcoin’s 2026 trajectory defies the standard post-halving playbook. While historical cycles typically see a parabolic surge in the months following a supply shock, the current market structure suggests a more grinding, structural bear phase. The initial euphoria that usually characterizes the early stages of a new cycle has been muted, replaced by a slow, steady decline that has tested investor conviction throughout the first half of the year.
This divergence from historical precedent is not merely a statistical anomaly; it reflects a fundamental shift in market dynamics. Institutional accumulation patterns have changed, and macroeconomic headwinds have created a resistance wall that previous cycles did not face. The result is a market that is less driven by speculative frenzy and more by cautious, calculated positioning. Investors are no longer buying the narrative of scarcity alone; they are demanding proof of utility and stability in an increasingly volatile financial landscape.
The current price action reflects this uncertainty. Rather than the sharp V-shaped recoveries seen in 2017 or 2021, 2026 has been characterized by lower highs and deeper corrections. This slow bleed has forced a reevaluation of long-term holding strategies, with many analysts now predicting a more extended accumulation phase before any significant upward movement can occur. The market is not dead; it is digesting the previous cycle’s excesses, but the path to recovery remains obscured by ambiguity.
Technical structure and key levels
Bitcoin’s trajectory in 2026 is defined by a post-halving consolidation phase. After the supply shock of the previous cycle, the market is digesting liquidity across a broad trading range. The current structure suggests a battle between long-term accumulation and short-term profit-taking, with price action oscillating between critical support and resistance zones. Understanding these boundaries is essential for navigating the volatility inherent in a bear market correction.
The primary resistance lies near the $82,500 level, a psychological barrier that has repeatedly capped upward momentum. Breaking above this zone requires sustained volume and a shift in macro sentiment. Conversely, the $75,000 support level acts as the floor for the current range. Historical data indicates a 26.5% probability of a breakdown below this threshold, signaling that downside risk is significant if buyer demand fails to absorb selling pressure. The $80,623 current price sits in the middle of this range, reflecting market indecision.
The daily chart reveals a tightening range, often a precursor to a significant directional move. Volume profiles suggest that liquidity is thinning near the current price, increasing the likelihood of a sharp breakout or breakdown. Traders are watching the $75,000 level closely; a sustained close below this mark could trigger a deeper correction toward previous cycle lows. Conversely, a reclaim of $82,500 with high volume would signal a resumption of the bull market trend.
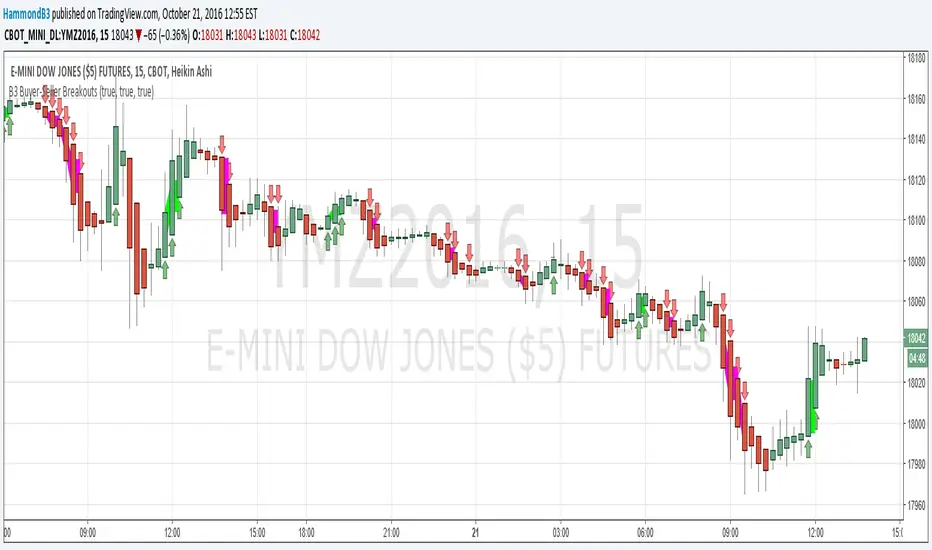
The B3 Buyer-Seller Breakouts indicator highlights the shifting balance of power between bulls and bears. In the current consolidation phase, the indicator shows alternating signals, reflecting the choppy nature of the market. This tool helps identify potential breakout points before they become obvious on standard price charts. By monitoring these signals alongside volume and key levels, investors can better time their entries and exits.
Halving cycle deviation analysis
Use this section to make the Bitcoin decision easier to compare in real life, not just on paper. Start with the reader's actual constraint, then separate must-have requirements from details that are merely nice to have. A practical choice should survive normal use, maintenance, timing, and budget. If a recommendation only works in an ideal situation, call that out plainly and give the reader a fallback path.
The simplest way to use this section is to write down the must-have criteria first, then compare each option against those criteria before weighing nice-to-have features.
Institutional flows reshape post-halving volatility
The 2026 post-halving cycle operates under a fundamentally different structural regime than previous iterations. The introduction of Spot Bitcoin ETFs has shifted the primary driver of price discovery from retail speculation to institutional capital allocation. This transition has dampened the extreme volatility characteristic of earlier cycles, replacing it with a more mature, albeit still turbulent, market dynamic.
Institutional participants, including pension funds and sovereign wealth vehicles, prioritize long-term balance sheet allocation over short-term trading signals. Their entry into the market has increased the baseline volume, absorbing sell pressure that previously triggered cascading liquidations. Consequently, price action in 2026 reflects a slower, more deliberate accumulation phase, distinct from the frenetic retail-driven pumps of 2017 or 2021.
This shift alters how market bottoms form. Rather than sharp, V-shaped recoveries driven by retail FOMO, the current cycle exhibits a series of higher lows, supported by steady institutional inflows. The market is less prone to sudden, sentiment-driven crashes, though it remains vulnerable to macroeconomic liquidity shifts. Understanding this institutional footprint is essential for navigating the 2026 landscape.
| Metric | 2021 Retail-Driven Cycle | 2026 Institutional Cycle |
|---|---|---|
| Primary Capital Source | Retail Investors, DeFi Yield | ETFs, Pension Funds, Sovereign Wealth |
| Volatility Profile | Extreme spikes, rapid liquidations | Dampened swings, steady accumulation |
| Price Discovery Mechanism | Social sentiment, meme cycles | Macro liquidity, institutional allocation |
| Market Depth | Shallow, prone to flash crashes | Deep, institutional order book support |
The integration of traditional finance infrastructure has also improved market resilience. Large-scale trades that would have caused significant slippage in previous years are now executed with greater efficiency through regulated exchanges. This institutional maturity suggests that while Bitcoin remains a high-risk asset, its trajectory in 2026 is increasingly decoupled from the whims of online retail sentiment.

No comments yet. Be the first to share your thoughts!